What’s New in TidierPlots.jl (2025)
About Me
- Epidemiologist (Former?)
- Currently: Analytics at Presage Group


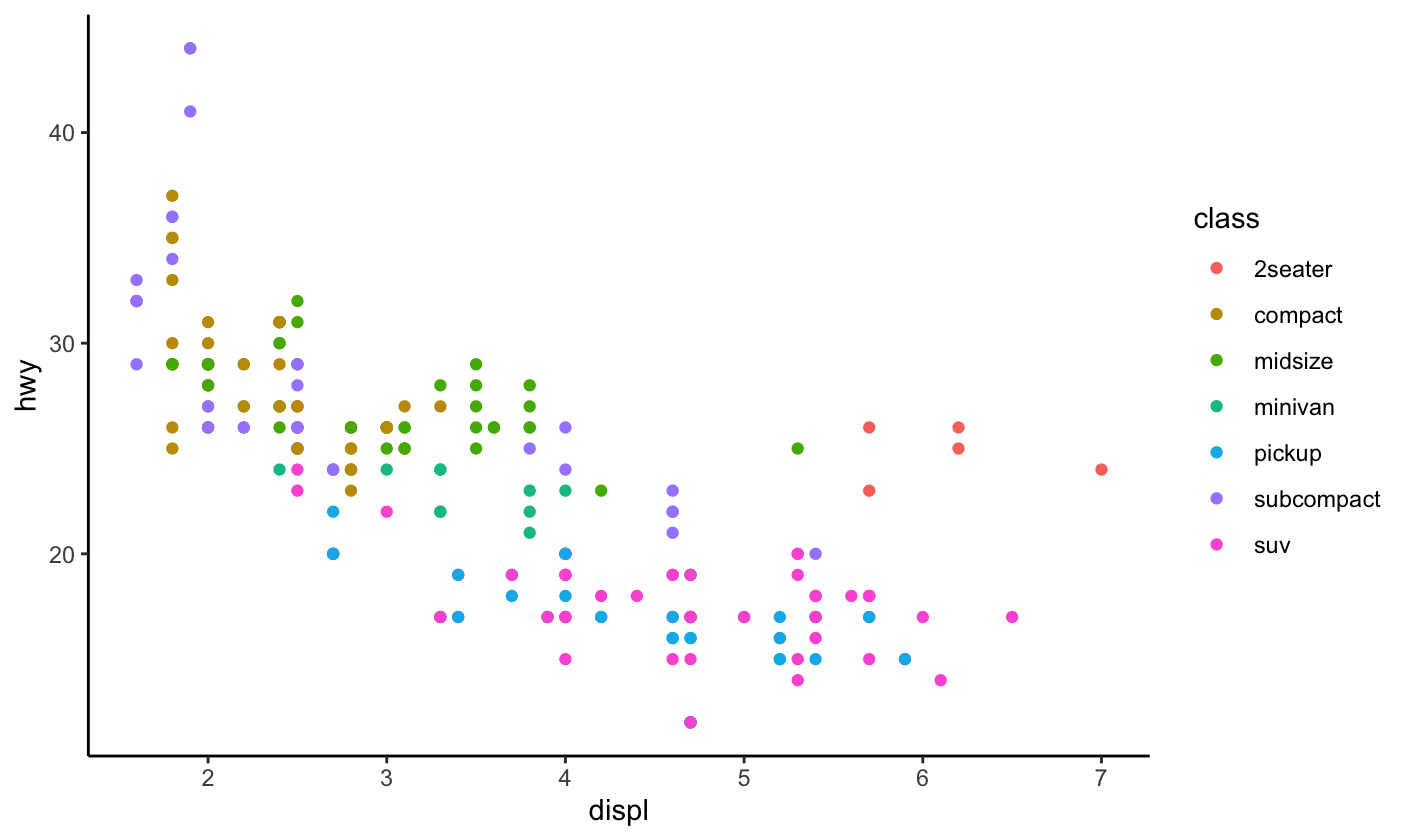
What can it do?
What can it do?
grid = ggplot(df) + theme .+
[geom_histogram(aes(x = :x),
    color = (:orangered, 0.5),
    strokewidth = 0.5) +
    lims(x = c(-4, 4)),
blank,
geom_histogram(aes(:y),
    color = (:dodgerblue, 0.5),
    direction = :x,
    strokewidth = 0.5) +
    lims(y = c(-3, 3)),
geom_point(aes(:x, :y), size = 10) +
lims(x = c(-4, 4), y = c(-3, 3)) +
    labs(x = "x", y = "y")]
+(grid...)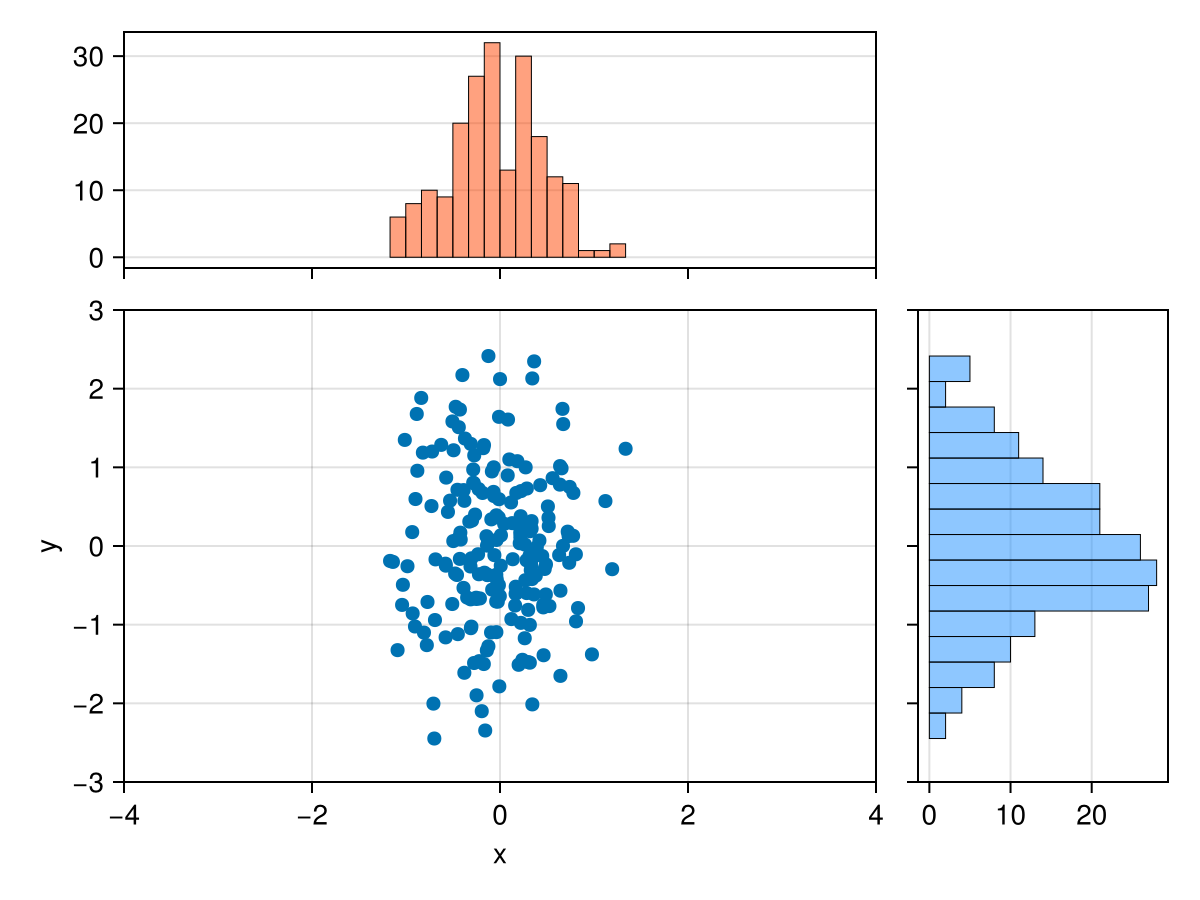
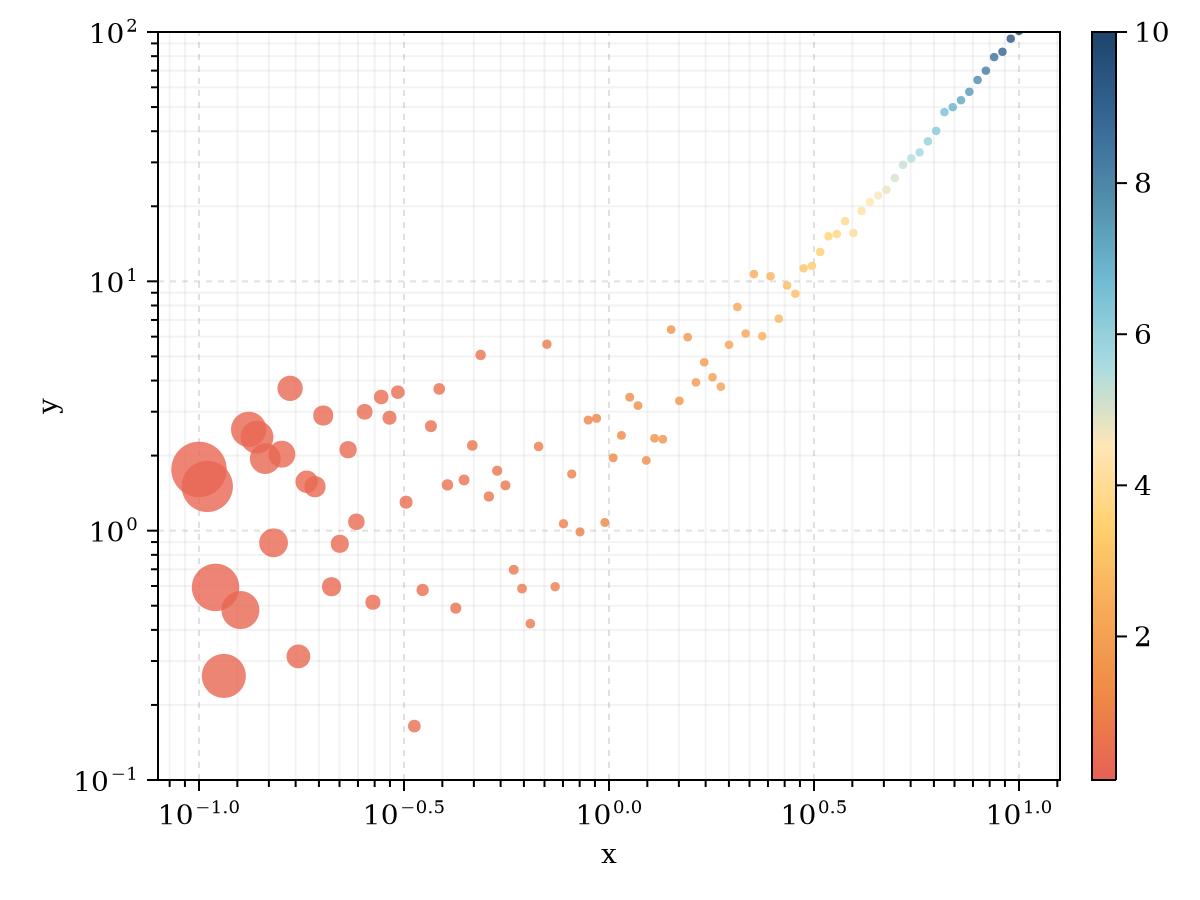
New Scales

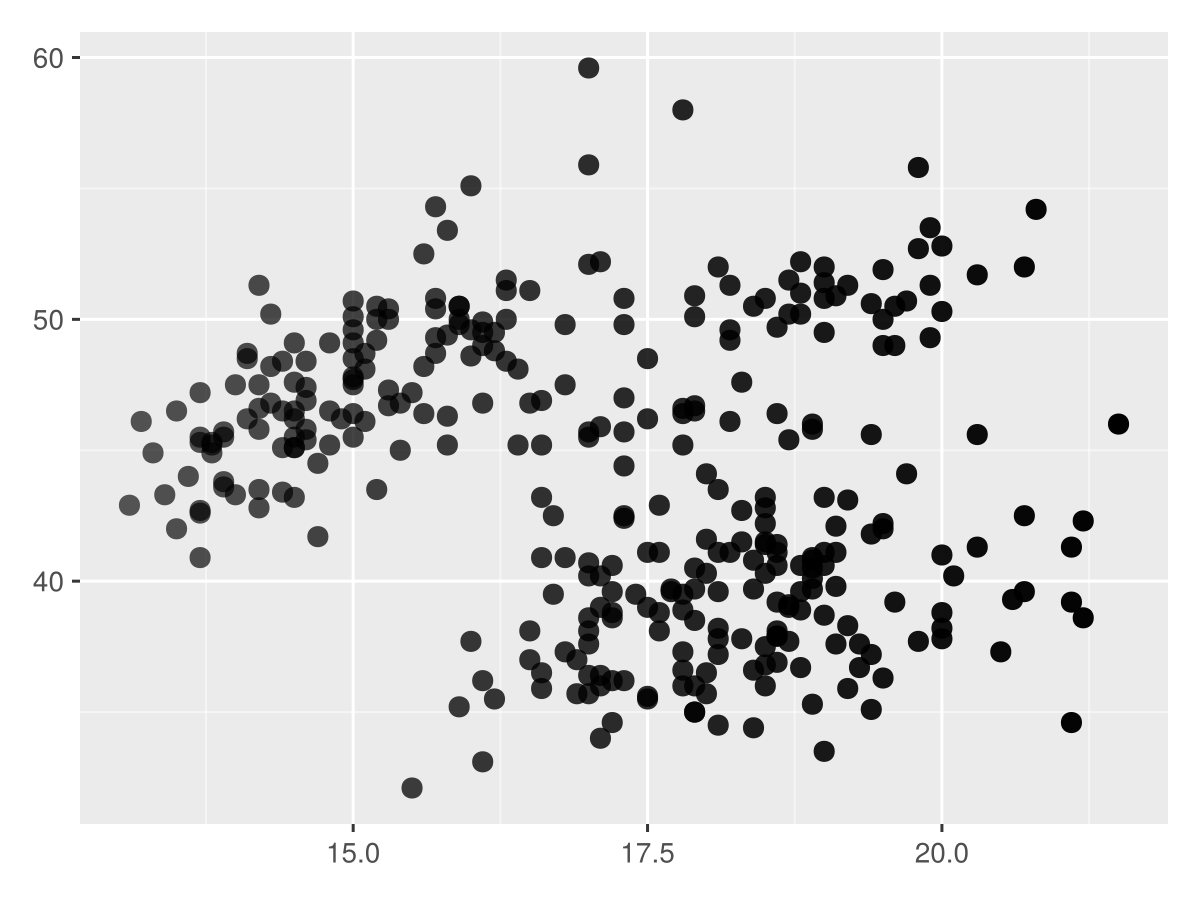
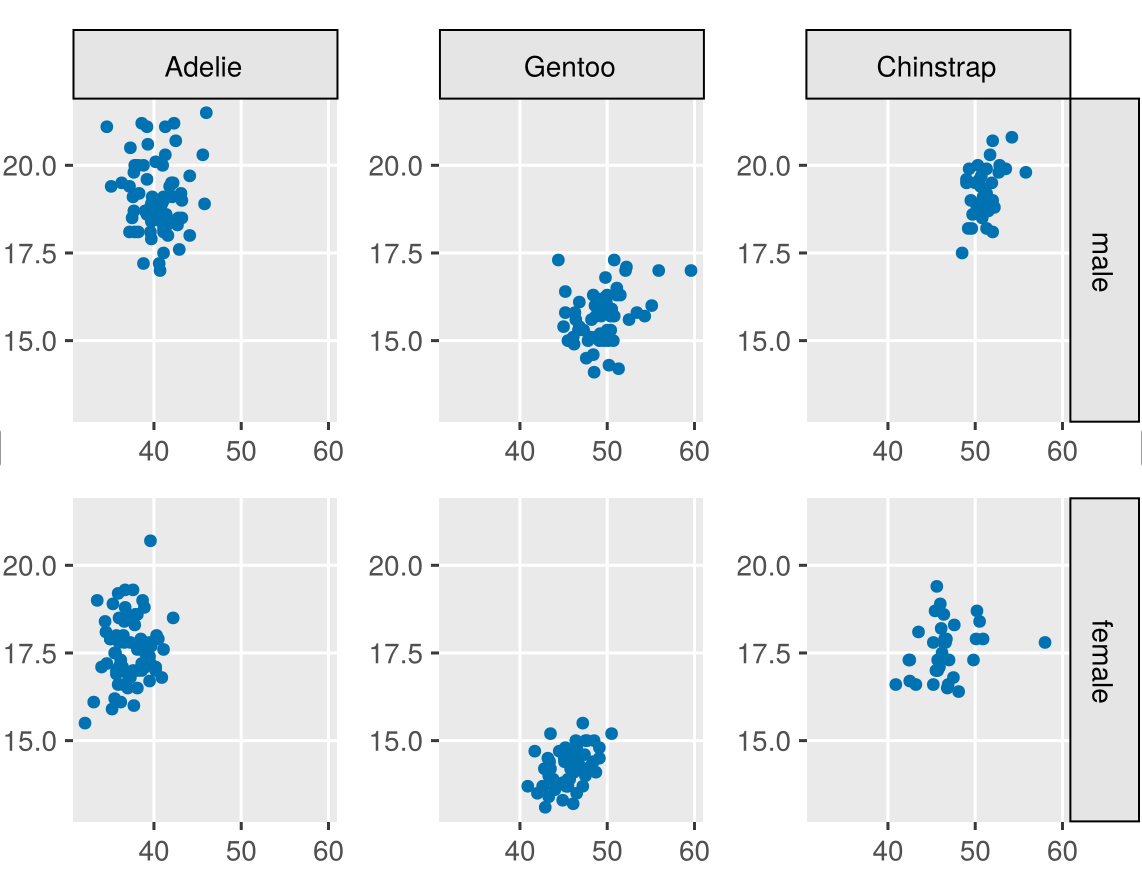
Facet Grids
Towards v1.0
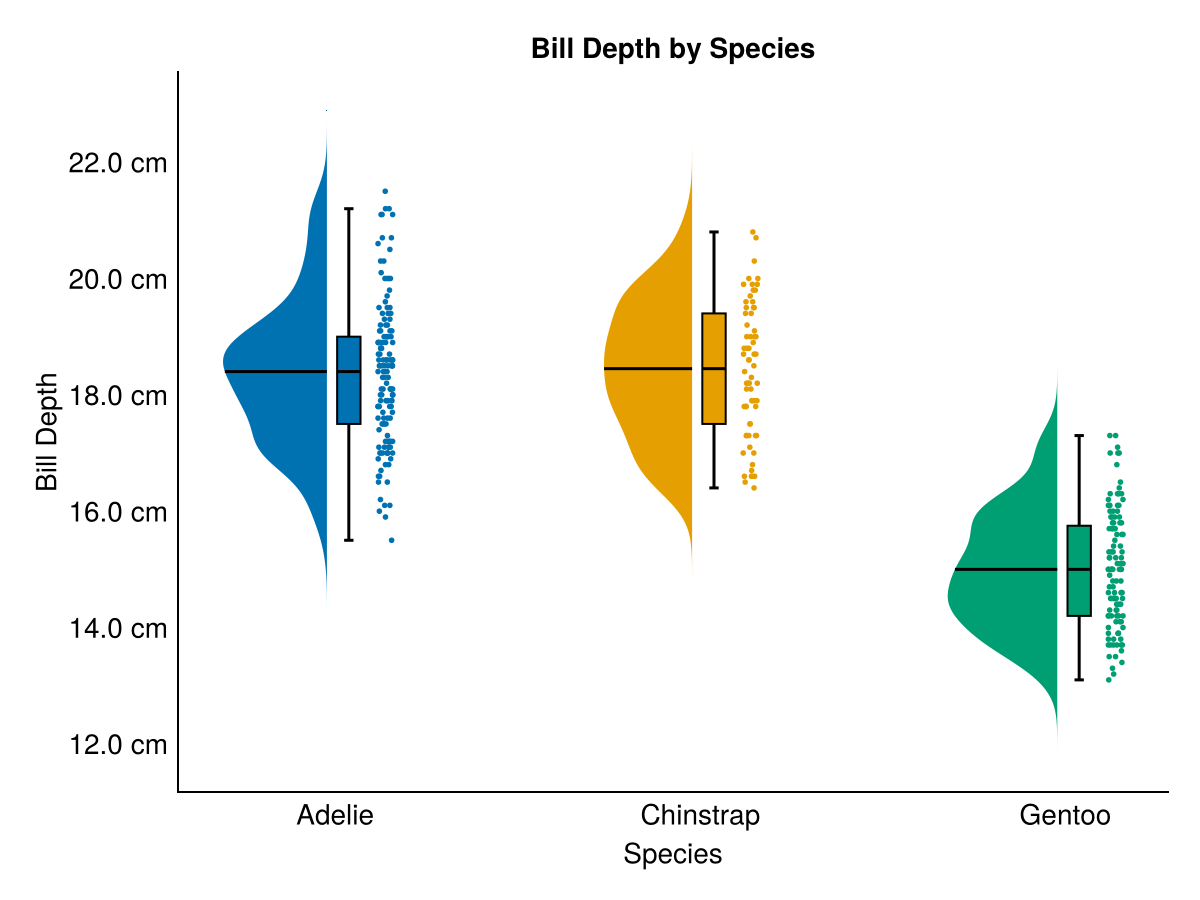
geom_raincloud = geom_template(
    "geom_raincloud",
    ["x", "y"],
    :RainClouds)

ggplot(penguins) +
    geom_raincloud(
        aes(x = :species,
            y = :bill_depth_mm,
            color = :species),
        size = 4) +
    scale_y_continuous(
        labels = "{:.1f} cm") +
    labs(title = "Bill Depth by Species",
         x = "Species",
         y = "Bill Depth") +
    theme_minimal()